
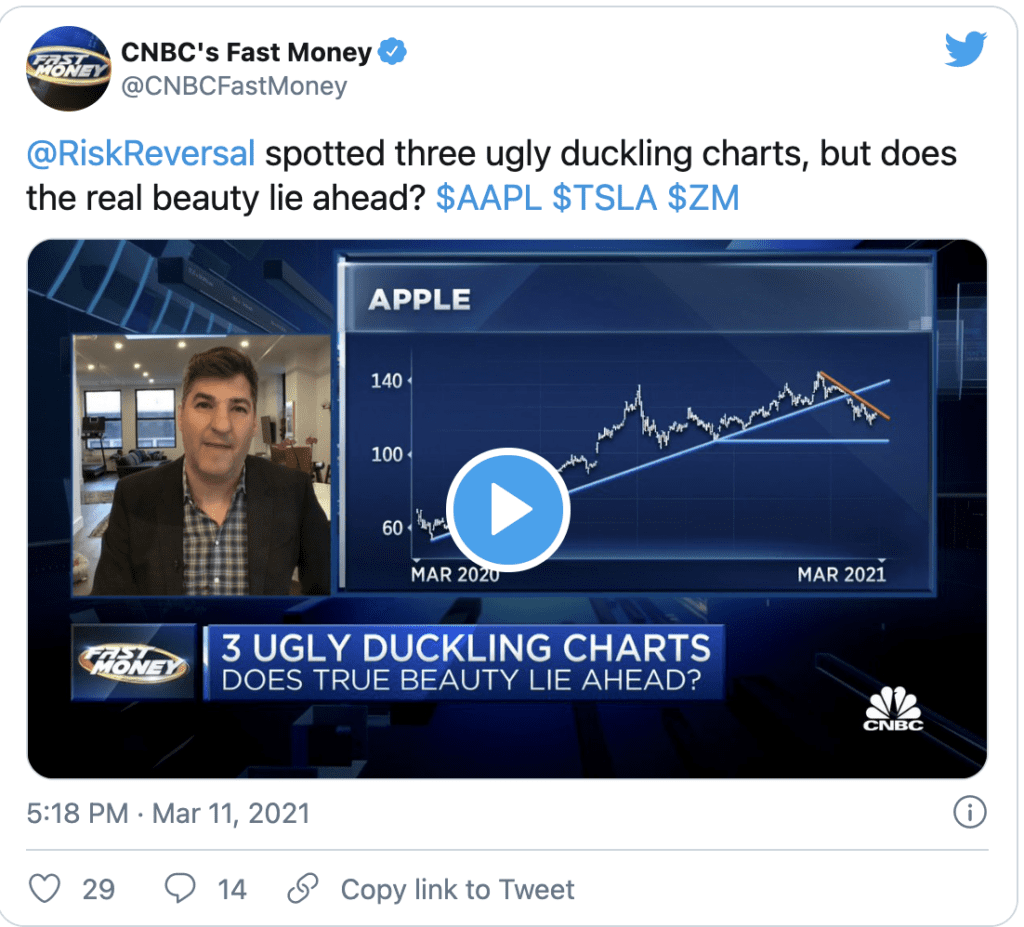
Last night on CNBC’s Fast Money, I ran through three charts that were prior stock market leaders for most of the pandemic but have since lost their luster… my producers referred to them as ugly ducklings. Watch the video here:
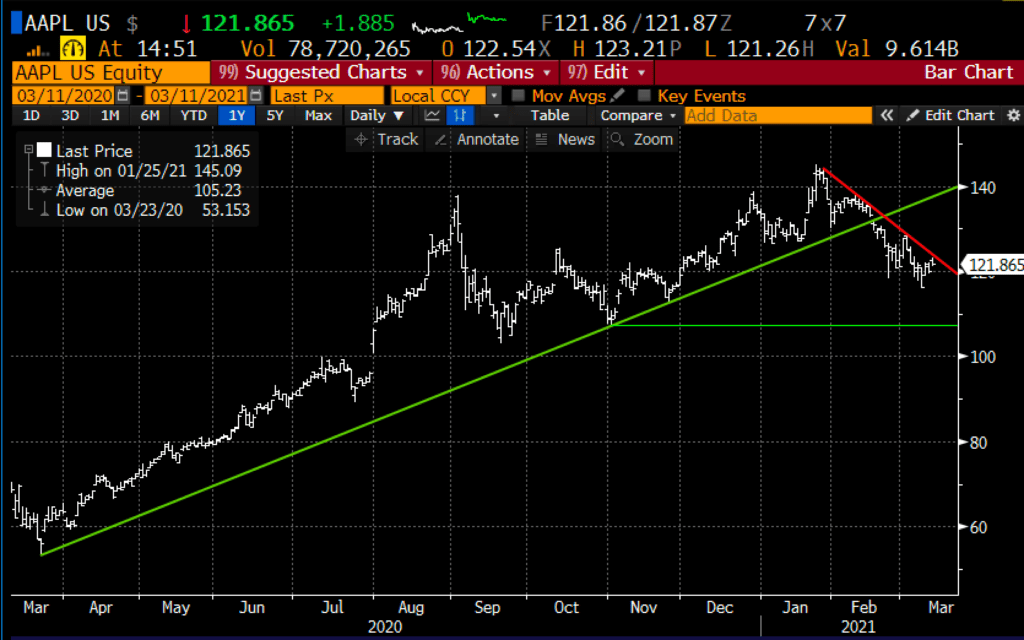
Apple (AAPL): Mega-cap tech name that has broken down from the uptrend since March 2020. A key level here could be the $107 level reached back in November. As Guy Adami has pointed out, we’ve seen meaningful sell-offs/peak to trough declines in AAPL historically (we saw a 25% decline in September). Based on this technical story, we could be looking at a similar situation here before the stock makes an attempt at a new high. You could bet short-term via a put spread on a move back down toward that level, or use it as a place to enter or reload on the stock.
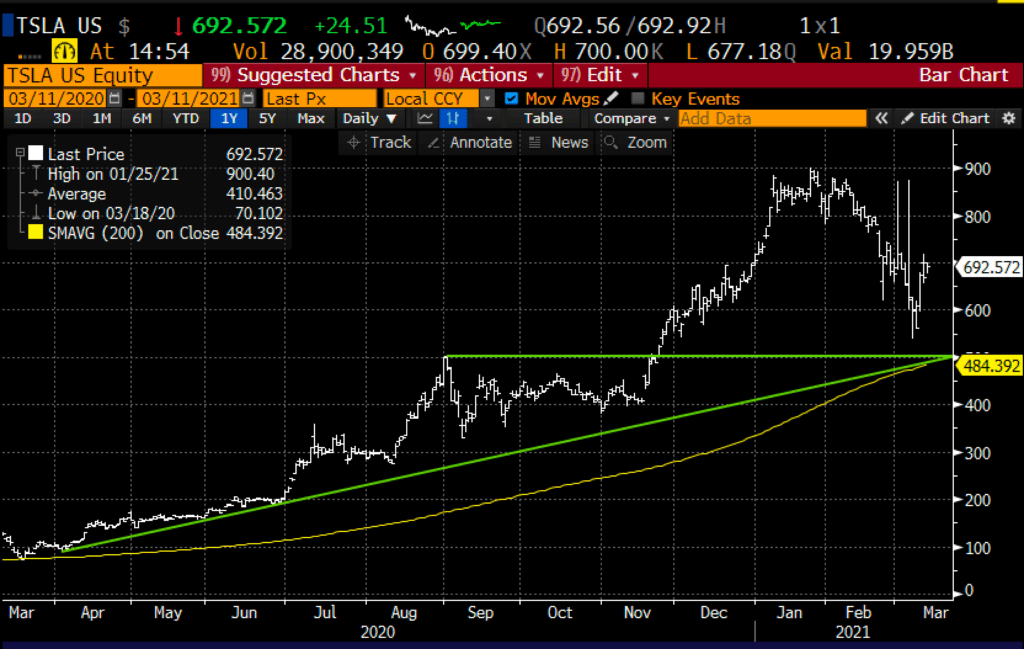
Tesla (TSLA): The company is bound to face more competition. Just think about the number of EV companies that have recently merged with and/or are going to merge with SPACs in the near future. The valuation is staggering and may start to come back down to earth. The 200-day moving average and prior resistance in late Aug/early Sept suggest a move down toward just below $500.
For what it is worth I picking up my new Ford Mustang Mach-e (that’s for electric) on Saturday… this is the actual car, looks pretty dope! Serious EV competition is finally coming, from Detroit, from German, and from Japan. The bulls better hope this really is a tech company, not an auto company as they have suggested for years.


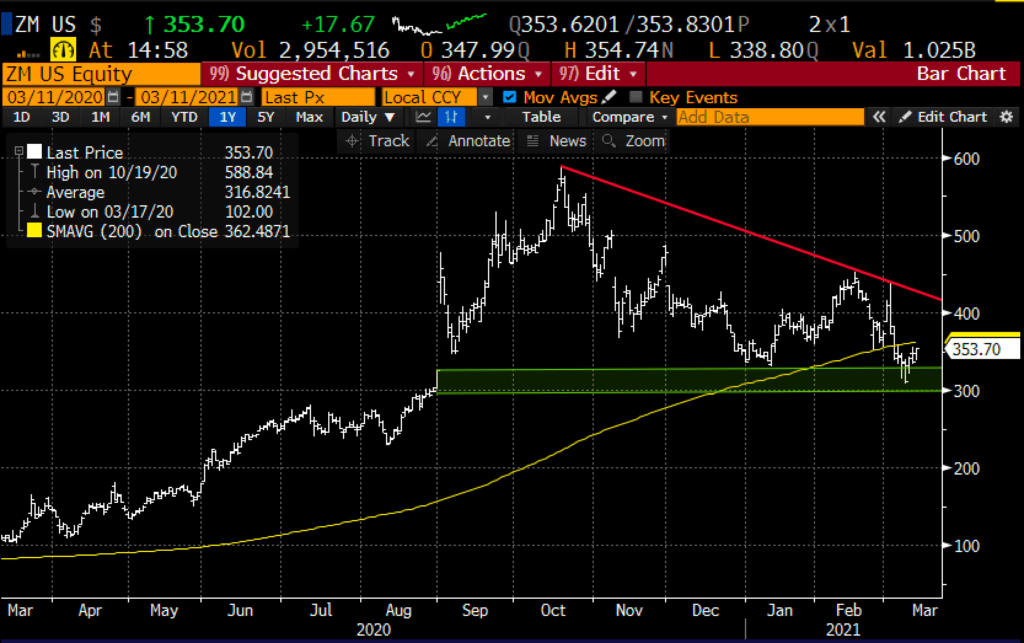
Zoom (ZM): The ultimate stay-at-home stock. The company has executed well, they have an excellent product and are now apart of the lexicon, but will have trouble growing into this valuation as they will start to face issues with growth. The chart is even worse, on a sustained downtrend since October with numerous failed breakout attempts. Near-term catalysts could be acquisitions that have been rumored and openly discussed by company executives as ZM has issued stock in the past few months. The stock could make a run back up toward $400, and fail again at the red downtrend line in the chart below.
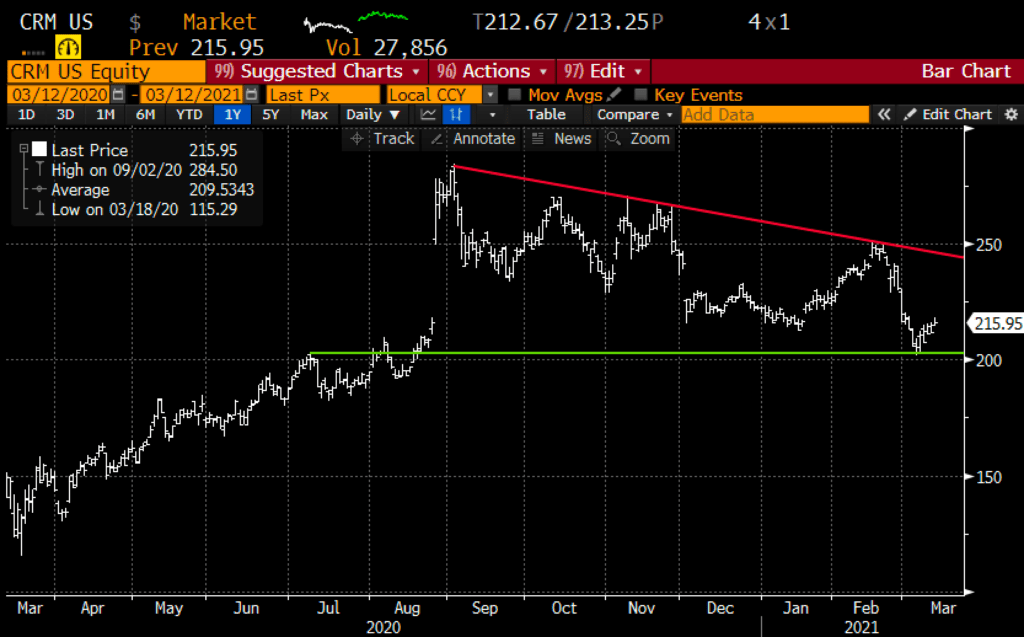
One last one that I did not get to last night is SalesForce.com (CRM). which looks pretty similar to ZM. Clear runway to the downtrend just below $250, which could set up as a short-term trade, but I guess I’d be more inclined to fade it there:
I bring these charts up as the S&P 500 (SPX) is making new all-time highs because it’s interesting that it is doing so without the participation of these once positive sentiment leaders!