
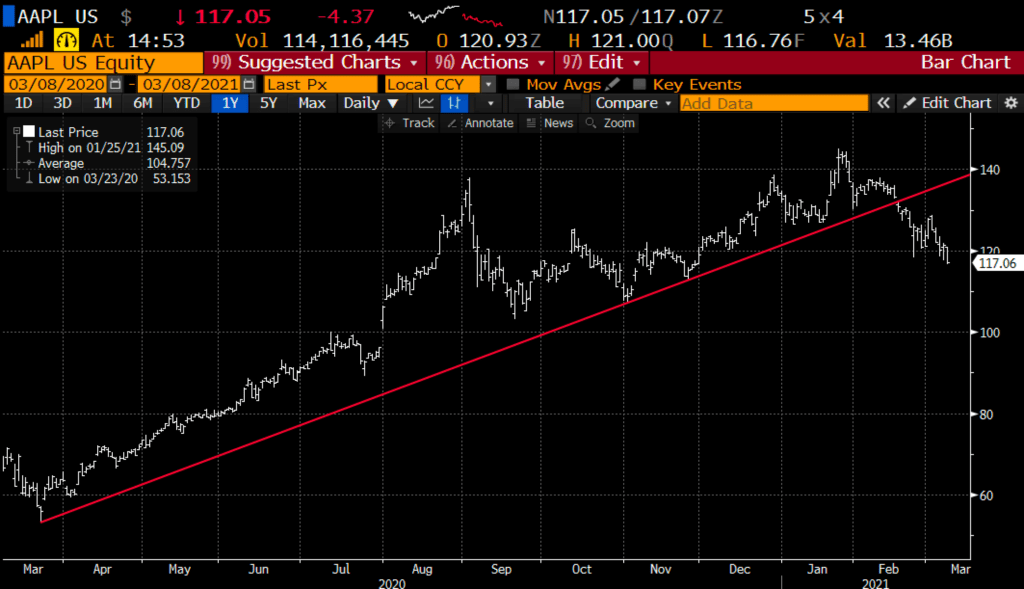
ICYMI: There is a massive rotation going on the stock market, out of growth and into cyclical value. We have been writing and speaking about it for months. It is not hard to identify… just look at the largest market cap company in the world, Apple (AAPL) down 20% from its all-time high made in late January, the first new high since early September, failing to confirm numerous new highs between Sept 2nd and late January. The technical breakdown is nothing short of nasty.
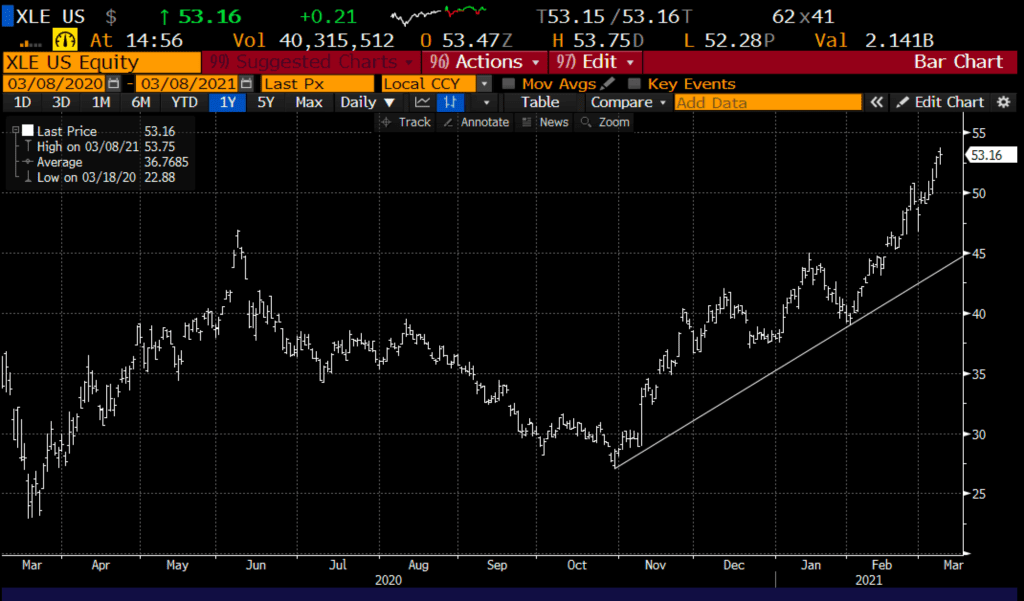
On the flip side, you have energy stocks absolutely ripping as the supply-demand dynamics in the oil patch are coming together after a nasty bear market, and just as it would appear the global economy is set to reflate. The XLE, the S&P Energy Select etf where Exxon (XOM) and Chevron (CVX) make up 45% of its weight, is up 40% on the year:
The underperformance in the Nasdaq year to date is staggering, not something we have said much of late over the last few years, with the composite down 1.3% year to date, off about 9.5% from its all-time highs made last month. Compare that to the S&P 500 (SPX), which is up 2.5% on the year and down only 3% from its all-time high made last month.
Part of the rotation has to do with the pace and availability of vaccines, but also the passing of a nearly $2 trillion stimulus bill… I suspect we might see a sort of sell the news once the bill is finally passed as it will take a bit for the cash to get into the economy and the markets are ready to reflect that enthusiasm, at least the SPX does.
On Friday, the SPX bounced off the uptrend from its March 2020 lows, a break this week, and it is headed back to its Nov breakout near 3600 and possibly as low as its 200-day moving average near 3500:
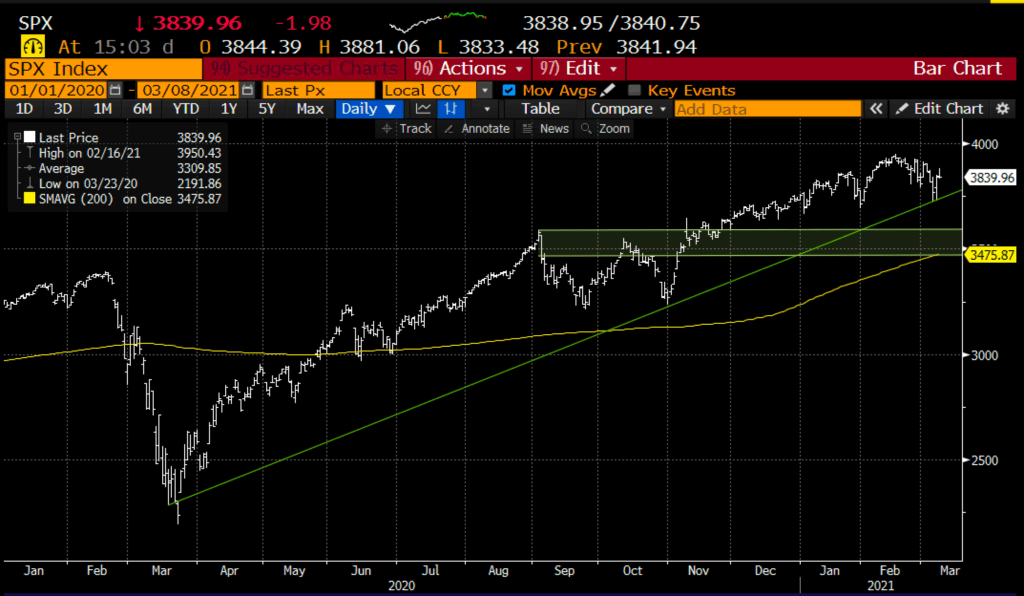
The index looks overextended to me with markets moving too far too fast, and coming back in a bit might make sense before reaching for new all-time highs.
SO what’s the trade? Buy Put Spreads in SPY, for instance…
Bearish Trade Idea: SPY ($383) Buy March 19th 380 – 360 put spread for ~$4
-Buy to open 1 March 19th 380 put for $5.50
-Sell to open 1 March 19th 360 put at $1.50
Break-even on March 19th expiration:
Profits of up to $16 between 376 and 360 with max gain of 16 at or below 360
Losses of up to 4 between 376 and 380 with max loss of 4 at or above 380
Rationale: this trade idea risks 1% of the etf price for a little less than 2 weeks, has a breakeven down 2%, and a max potential gain of 4.2% if the etf is down 6% in 8 trading days