

In The Money is brought to you by

Shortly after the open today, I filmed my weekly In The Money segment with Fidelity Investments. Click below to watch and see my notes below the video:

Here are my notes from today’s show:
Macro: Have equity investors priced in the coming rate hike cycle?? The Fed has suggested that they will be aggressive if necessary to slow inflationary pressures, the very pressures that are causing supply shortages, increased shipping and wage costs, and input costs like energy, all of which have the potential to crimp corporate earnings and profits. With the 10% rally over the last week and a half, the S&P 500’s 10% rally, placing the index down only 5% on the year does not adequately reflect the uncertainty in the global economy and the potential for near-term earnings downgrades. Per FactSet, the forward PE of the S&P 500 is in line with its 5-year average at about 19x, but still, above its 10-year average of about 17x, I suspect the market won’t bottom until we see it below the 10-year average
Trade Idea #1: Hedge or Play for re-test of March lows in SPY. The SPY is at its 150 days moving average, I see a re-test of the March lows and possibly a re-test of the Apr 2021 breakout near
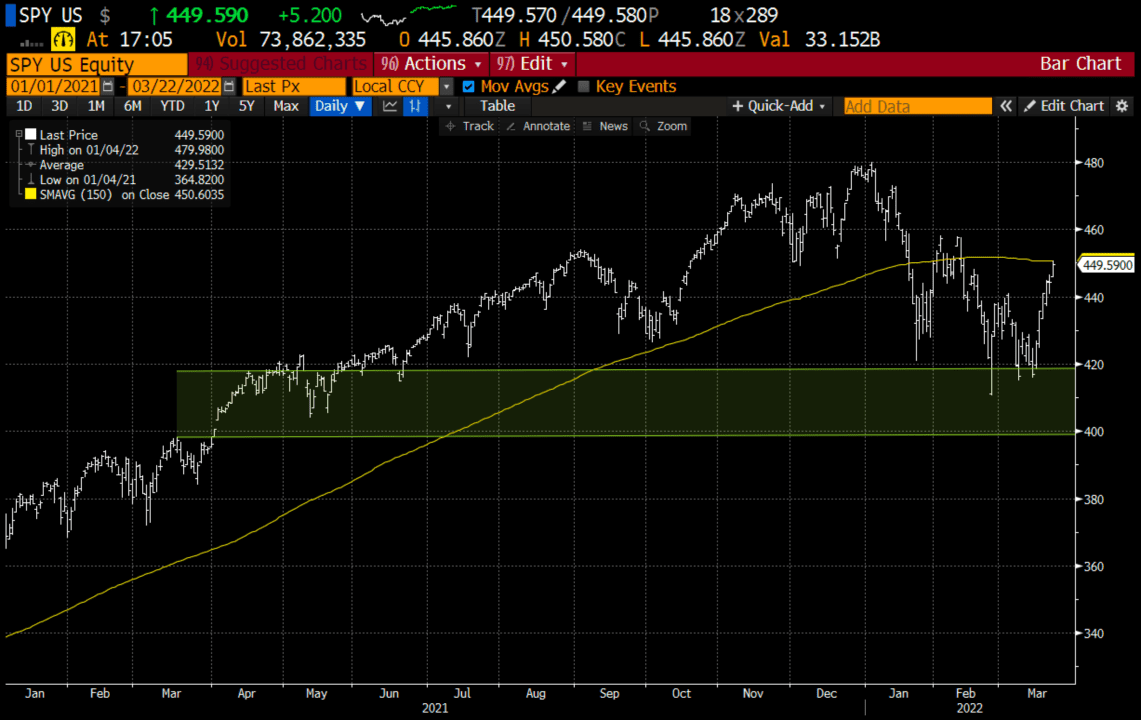
Bearish Trade Idea: SPY ($449) Buy May 450 – 400 put spread for ~$10
-Buy to open 1 May 450 put for $14
-Sell to open 1 May 400 Put at $4
Break-even on May expiration:
Profits of up to $40 between 440 and 400 with a max gain of 40 below 400
Losses of up to 10 between 440 and 450 with a max loss of 10 above 450
Rationale: this trade idea risks 2.2% of the ETF price, has a break-even down 2%, and has gains of nearly 10% if the ETF is down 12% in a little more than 2 months.
Trade Idea #2: Single stock volatility in some of your favorite stocks is off the hook, which does not feel representative of an S&P 500 that is down only 6% from its all-time highs up nearly 10% from its recent lows.
Take TSLA for example, a $1 trillion market cap stock that has gained 30% in just the last week. The stock has a beta of 1.70 to the SPX yet the SPX has rallied 10% and TSLA has rallied 30%. Something seems off here. The technical setup seems a bit precious and the slightest bit of disappointing fundamental news on the delivery front due to supply chain issues or possibly slowing demand as prices go up could cause the stock to re-test last month’s lows near $700 or possibly as low as $600.
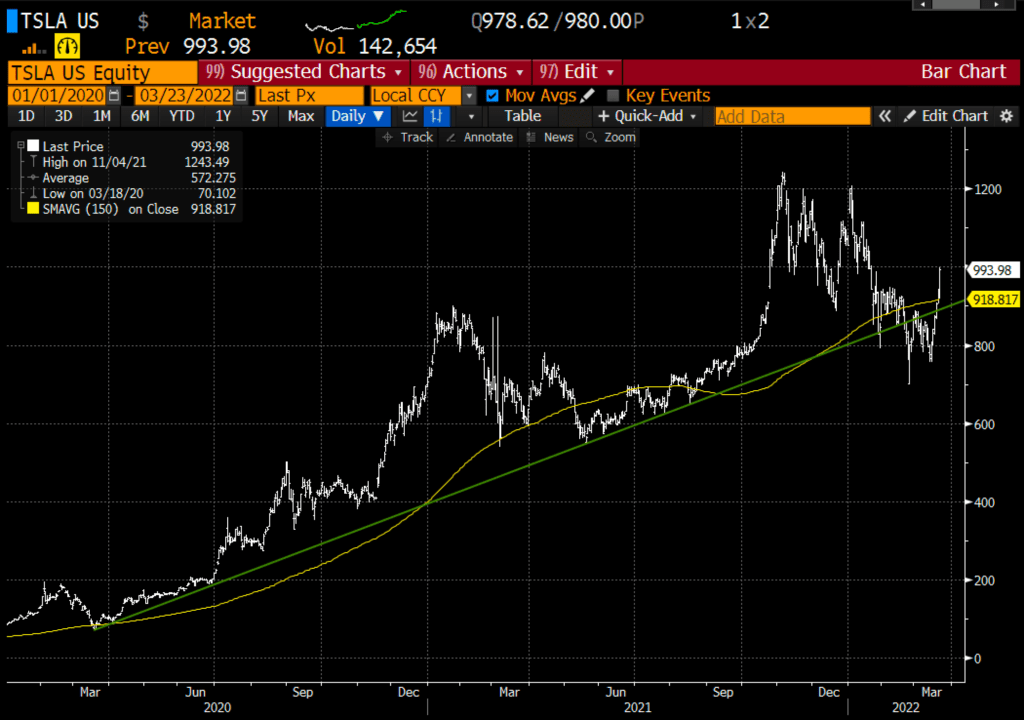
Consider a near-term hedge into earnings next month and what could be a continued rocky period for markets that are trying to get their arms around the Fed’s new stance of aggressive rate hikes.
Hedge – Trade Idea: TSLA vs 100 shares long at $995 Buy 1 May 1200 – 830 collar for even money
-Sell to open 1 May 1200 call at $34
-Buy to open 1 May 830 put for $34
Break-even on May expiration:
Profits of up to 205 in the stock up to 1200, stock called away at 1200, up 20% from current levels, slight;y below its all-time highs of 1243 made in November. Long stockholders could always cover short call to keep the long position intact.
Losses of stock down to 830 or about 160, protected below.
Rationale: a long holder would place a hedge on a position like TSLA if they did NOT want to sell but want to define their risk to the downside, without paying anything to do so, aside from giving up some potential upside between now and May expiration
Lookback – On Feb 23 when PYPL was $103 I detailed a bullish trade idea:
PYPL $103 Buy April 110 call for $4
Now with the stock at $115 those calls are now worth $9, I take half off.