
A little more than a month ago I laid out a near-term bearish view in small-cap stocks via the IWM, the etf that tracks the Russell 2000 (read here). That was a very bad call, the IWM is up more than 10% since investors are clearly viewing the group as massive beneficiaries of increased fiscal stimulus, better virus management & vaccine rollout, and essentially an earlier than expected return to pre-pandemic economic activity.
Well, Regular readers know I am nothing if NOT persistent which is one of the main reasons why RiskReversal.com was set up to educate and help readers express their views in markets using defined risk.
Here was my commentary from Jan 5th:
Small-cap stocks, as measured by the IWM etf that tracks the Russell 2000 went parabolic, up 30% since Halloween. Small caps are made up of mostly domestically focused companies, many hard hit by the pandemic, in financials and energy, and have outperformed their large-cap brethren on optimism of perpetually low rates, further fiscal stimulus, and vaccines putting an end to the pandemic by mid-2021.
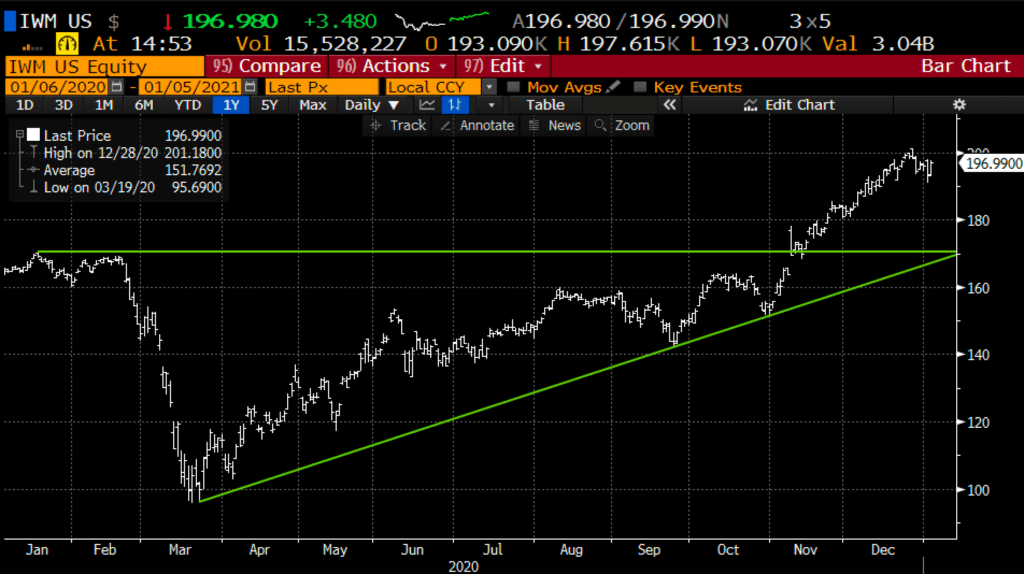
The one year chart below of the IWM shows the convergence of the uptrend from its March lows with the early November breakout to new 52-week highs, just above $170:
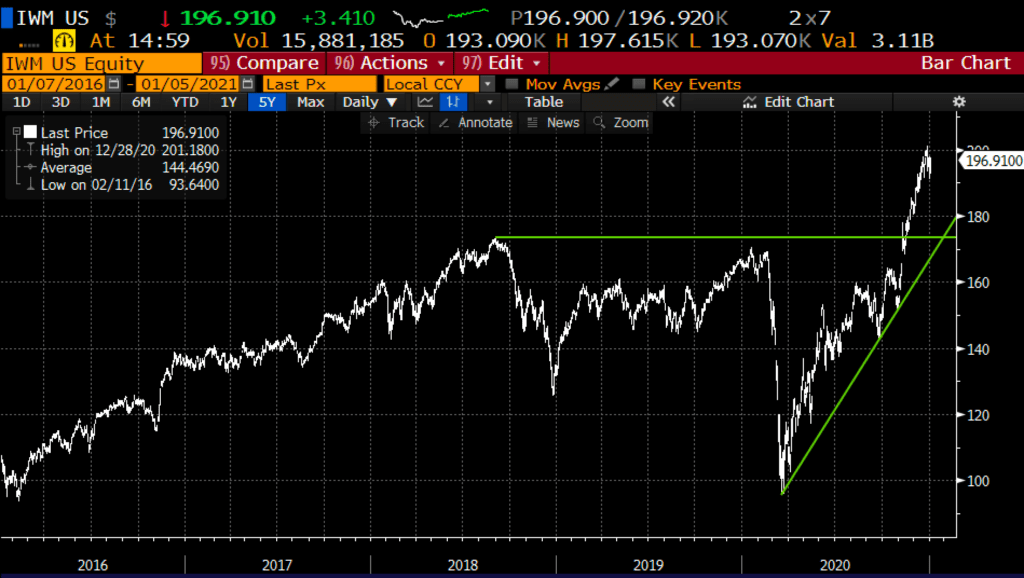
The five-year chart below shows the breakout above its prior all-time high back in mid-2018 near $174:
If the markets were to correct, small caps could be viewed as the most vulnerable given the recent outperformance and the sensitivity to a delayed economic recovery in 2021 that current stock market valuations have priced in. A run of the mill 10% correction in the IWM from current levels would have the etf back near the recent breakout in the mid $170s.
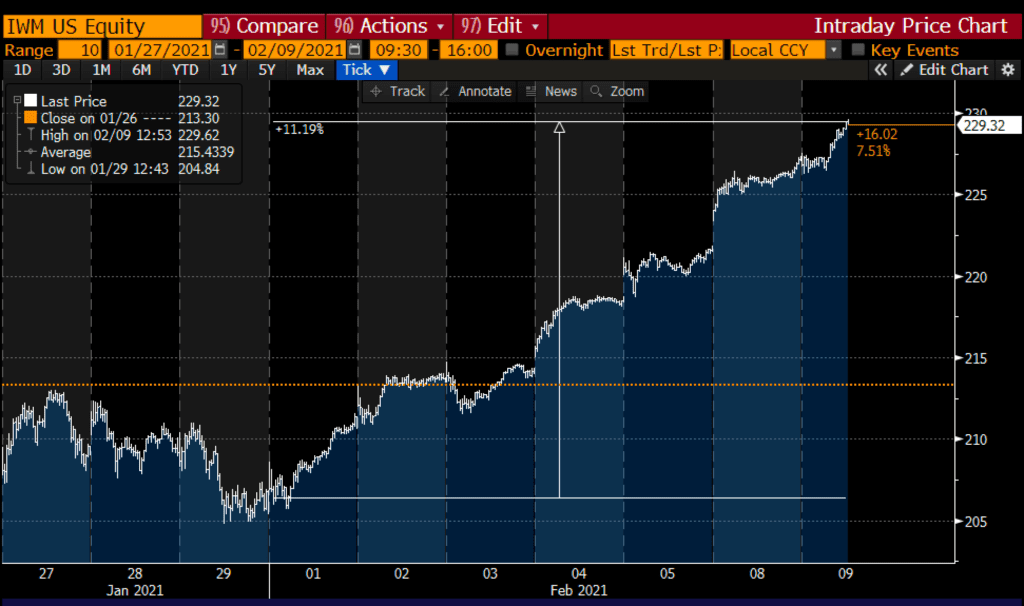
Not much has changed in my view, except for the price of the IWM. While it also looks like we will get big fiscal stimulus, and that the recent virus surge might be lessening, and the vaccine rollout is set to hum a bit, the price appreciation of the IWM might incorporate that good news up 16% on the year, up 11% already this month alone, massively outperforming the S&P 500’s 4.25% year to date gains and the Nasdaq’s nearly 9% ytd gains:
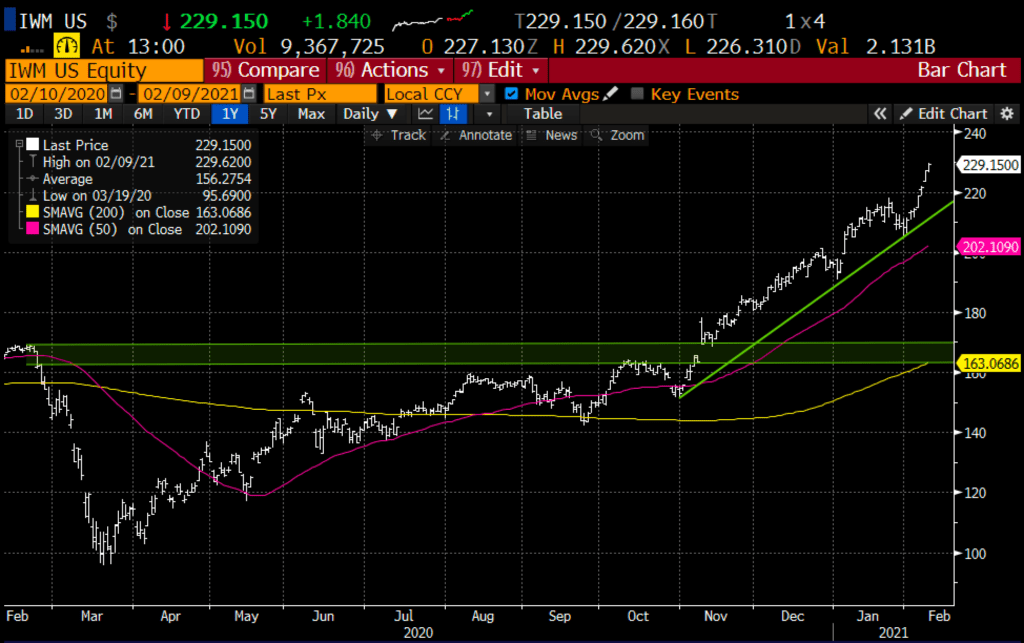
The IWM is up more than 40% from its 200-day moving average which happens to be very near where the etf was trading on election day in early November (yellow line) and 12% above its 50-day moving average (purple line) just below its uptrend from its Nov lows:
So what’s the trade? Bet on Gravity… I am mean put spreads… near term, a correction before equities march higher in back half of the year with the benefit of pandemic largely behind us, our economy ready to be unleashed with the combo of pent up demand, consumer and corporate balance sheets in great shape and a sort of YOLO catch trade on the demand side.. . But first need to shake out some weak hands, things feel a tad to easy at the moment:
Bearish Trade Idea: IWM ($229) Buy March 225 – 200 put spread for $5
-Buy to open 1 March 225 put for $6.80
-Sell to open 1 March 200 put at $1.80
Break-even on March expiration:
Profits of up to 20 between 220 and 200 with max gain of 20 at 200 or lower
Losses of up to 5 between 220 & 225 with a max loss of 5 above 220
Rationale: this trade idea risks 2.2% of the etf price, breaks-even down 4%, and has a max gain of 9% if the IWM is down 12.5% in a little more than 5 weeks.