
On December 10th I took a look at the technical setup in shares of The Home Depot (HD) in a post Home is Where the K Is, suggesting:
The loss of momentum over the last few months, not keeping pace with the S&P 500 (SPX), made a new all-time high late last month above its prior high on Sept 2nd and is now down just 1% its all-time high made yesterday, is notable. This underperformance over the last 6 weeks is likely due to the uncertainty about the near-term fiscal stimulus.
This technical set-up is a bit treacherous, in my opinion. If you think that we are not going to get meaningfully fiscal stimulus for months and that recent economic data that shows waning job growth, consumer spending, confidence, and savings rates could lead to a double-dip recession in the first half of 2021, then playing for a break of support and retest of $240 makes sense down about 10% from current levels.
Six days later when shares of HD were trading $270 I detailed the following bearish trade idea on my weekly In The Money segment with Fidelity Investments (read and watch here):
Bearish Trade Idea: HD ($270) Buy Jan 22nd wkly 265 – 240 Put Spread for $4.50
With 6 trading days to Jan expiration, and this trade idea expiring, I want to take another look at HD, which is down about 1% since mid-December, despite the S&P 500 (SPX) being up 2.5%.
With the stock at $267.50, this put spread is worth about $3.10, representing a $1.40 loss. My view has not changed on HD, and the stock’s relative underperformance and its weak technicals suggest that I a break of $260 support since May, just above its 200-day moving average:
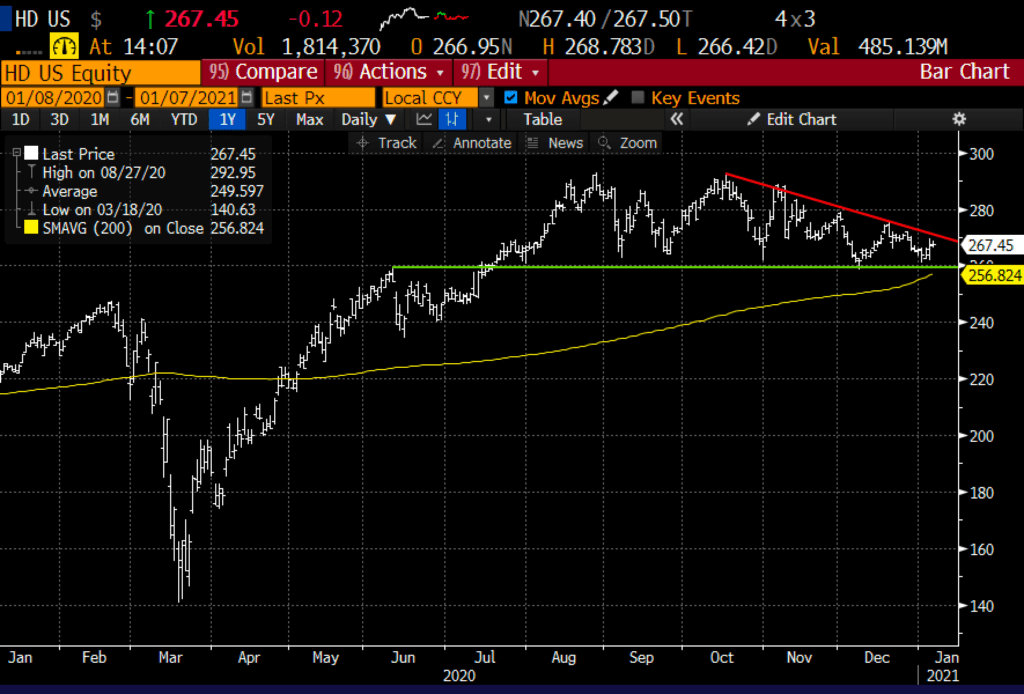
The next identifiable catalyst for shares of HD will be its Q4 earnings which should fall in the last week of February.
I want to close for a loss the Jan trade idea and roll down and out to catch earnings.
New Trade Idea: HD ($267) Buy March 265 – 240 – 215 Put Butterfly for $5
-Buy to open 1 March 265 put for $11
-Sell to open 2 March 240 puts at $3.50 each, or $7 total
-Buy to open 1 March 215 put for $1
Break-even on March expiration:
Profits of up to 20 between 265 and 215 with a max gain of 20 at 240
Losses of up to to 5 between 215 and 220 & between 260 and 265, with a max loss of 5 below 215 or above 265
Rationale: this trade idea risks less than 2% of the stock price, has a break-even down 2.6% and a max gain of 7.5% of the stock price if the stock is down 10% in two months.