
Shortly after the open today, I filmed my weekly In The Money segment with Fidelity Investments. Click below to watch and see my notes below the video:

My Notes:
Macro: Earnings season is upon us… four times a year, take it to the bank, publicly-traded stocks have to report results for the prior three-month period. Equity options are the easiest way to get a glimpse into market expectations for the results and forward guidance by looking at the “implied one-day earnings move”. If that move is high on an absolute basis and relative to the stock’s past one-day performance post results than one can assume that expectations are high
For instance, CAT reports its Q4 results this Friday before the open, the stock is trading at $185, take the at the money straddle (the call premium + the put premium) and divide that by the strike price, and you get the implied movement, in this case, $9 or about 5%. On average over the last four quarters, CAT has moved only about 2.25% the day after earnings…
This is a good little back of the envelope exercise for figuring out implied earnings moves.
____________________________________________________________________________
Trade Idea #1: Hedge for large tech holdings… QQQ / Nasdaq 100
FB, MSFT, AAPL, GOOGL, AMZN & TSLA make up 45% of the weight of the Nasdaq 100…. the index at is all-time highs yesterday was up 20% from the Nov 3rd election… sitting 18% above its 200-day moving average and up 5% on the year.
Last week saw a surge into mega-cap tech again, which I think many investors view as defensive positioning given these companies’ monopolies and balance sheets.
MSFT reported a blowout quarter last night, stock only up a little at an all-time high, AAPL likely to do the same tonight, but who is the incremental buyer, and will investors start to price higher corporate taxes and regulation?
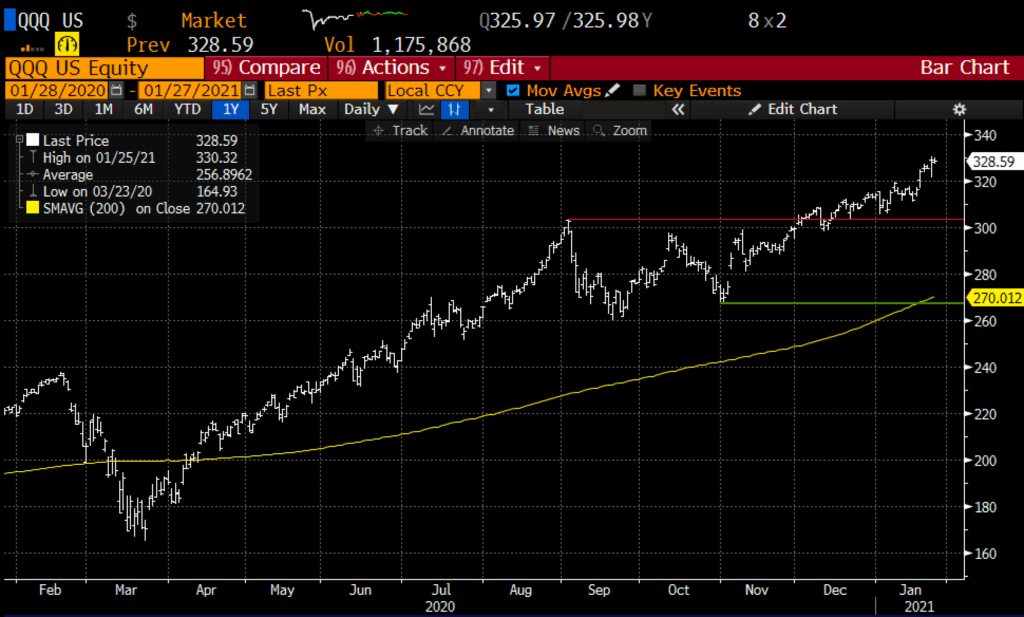
Hedge Idea: QQQ ($326) Buy March 325 – 275 Put Spread for $10
-Buy to open 1 March 325 put for $13
-Sell to open 1 March 275 put at $3
Break-even on March Expiration:
Profits of up to 40 between 315 and 275 with max gain for 40 at 275 or lower
Losses of up to 10 between 315 and 325 with max loss of 10 above 325
Rationale: this trade idea risks 3% of the etf price, has a break-even down 3.5% and has a max gain (or risk mitigation) of 12% if the index is down 15% in two months,
____________________________________________________________________________
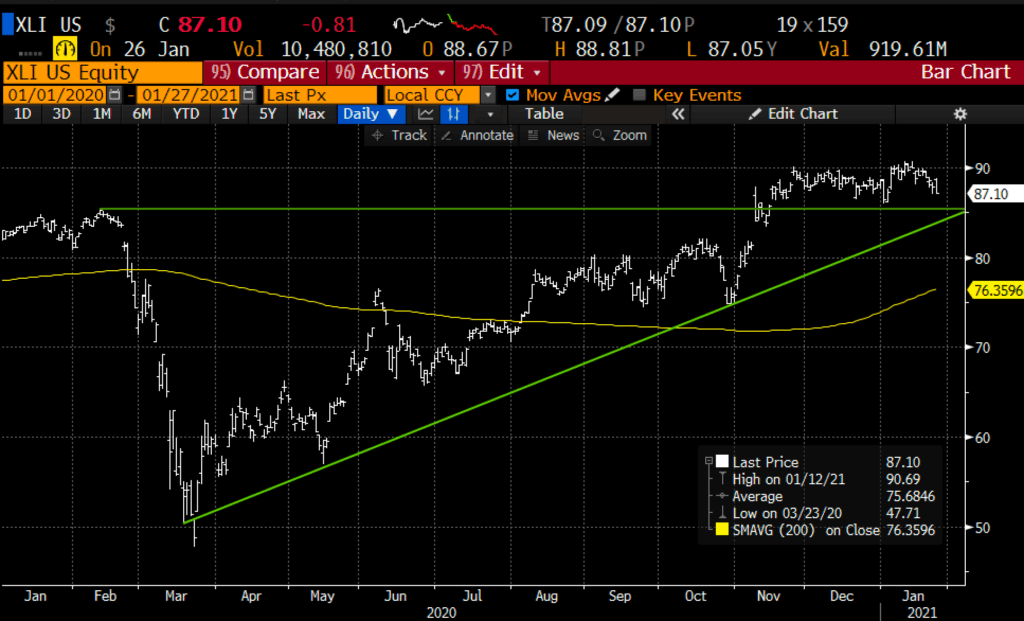
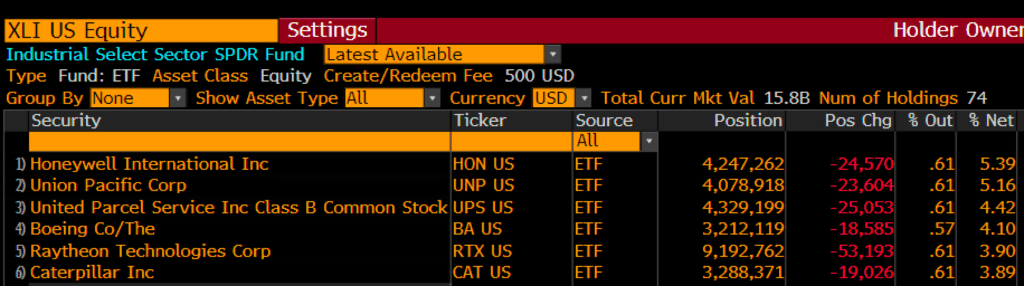
Trade Idea #2: Bearish Industrials via XLI, top holdings
Trade Idea: XLI ($85) Buy March 85 – 75 put spread for $2.50
-Buy to open 1 March 85 Put for $3.25
-Sell to open 1 March 75 put at 75 cents
Break-even on March expiration:
Profits of up to 7.50 between 82.50 and 75 with max gain of 7.50 at 75 or lower.
Losses of up to 2.50 between 82.50 and 85 with max loss of 2.50 at or above 85
Rationale: this trade idea risks ~3% of the etf price, breaks-even down about 3%, and has a max gain of 12% if the XLI is down 12% in a little less than two months.
Technicals are ok until they are not…
$85 support going back to its Feb highs and the intersection of its uptrend from March lows.
____________________________________________________________________________
Lookback #1: On Dec 23 I detailed a bullish trade idea in the XLV the S&P Healthcare etf
Trade Idea: XLV ($112) Buy Feb 106 – 116 Risk Reversal for even
-Sell to open 1 Feb 106 put at $1.60
-Buy to open 1 Feb 116 call for $1.60
Now with the XLV at &116, the risk reversal is worth about $2, the short put is offered at 30 cents and the long call is worth about $2.30… it makes sense to manage this trade…. first buy to cover the short put. that takes off any risk that is not defined… and second consider rolling the profit in the long call up and out… or merely taking the gain…